Download Solved Problems on Kinematics in One Dimension | PHYS 110 and more Quizzes Physics in PDF only on Docsity!
© 2005 Pearson Education, Inc., Upper Saddle River, NJ. All rights reserved. This material is protected under all copyright laws
as they currently exist. No portion of this material may be reproduced, in any form or by any means, without permission in
writing from the publisher.
CHAPTER 2: Kinematics in One Dimension
Quest 1,4; Prob 1, 3,5,7,9,11,17a,18,21,25,33,37,
Answers to Questions
- A car speedometer measures only speed. It does not give any information about the direction, and so
does not measure velocity.
- For both cars, the time elapsed is the distance traveled divided by the
average velocity. Since both cars travel the same distance, the car
with the larger average velocity will have the smaller elapsed time.
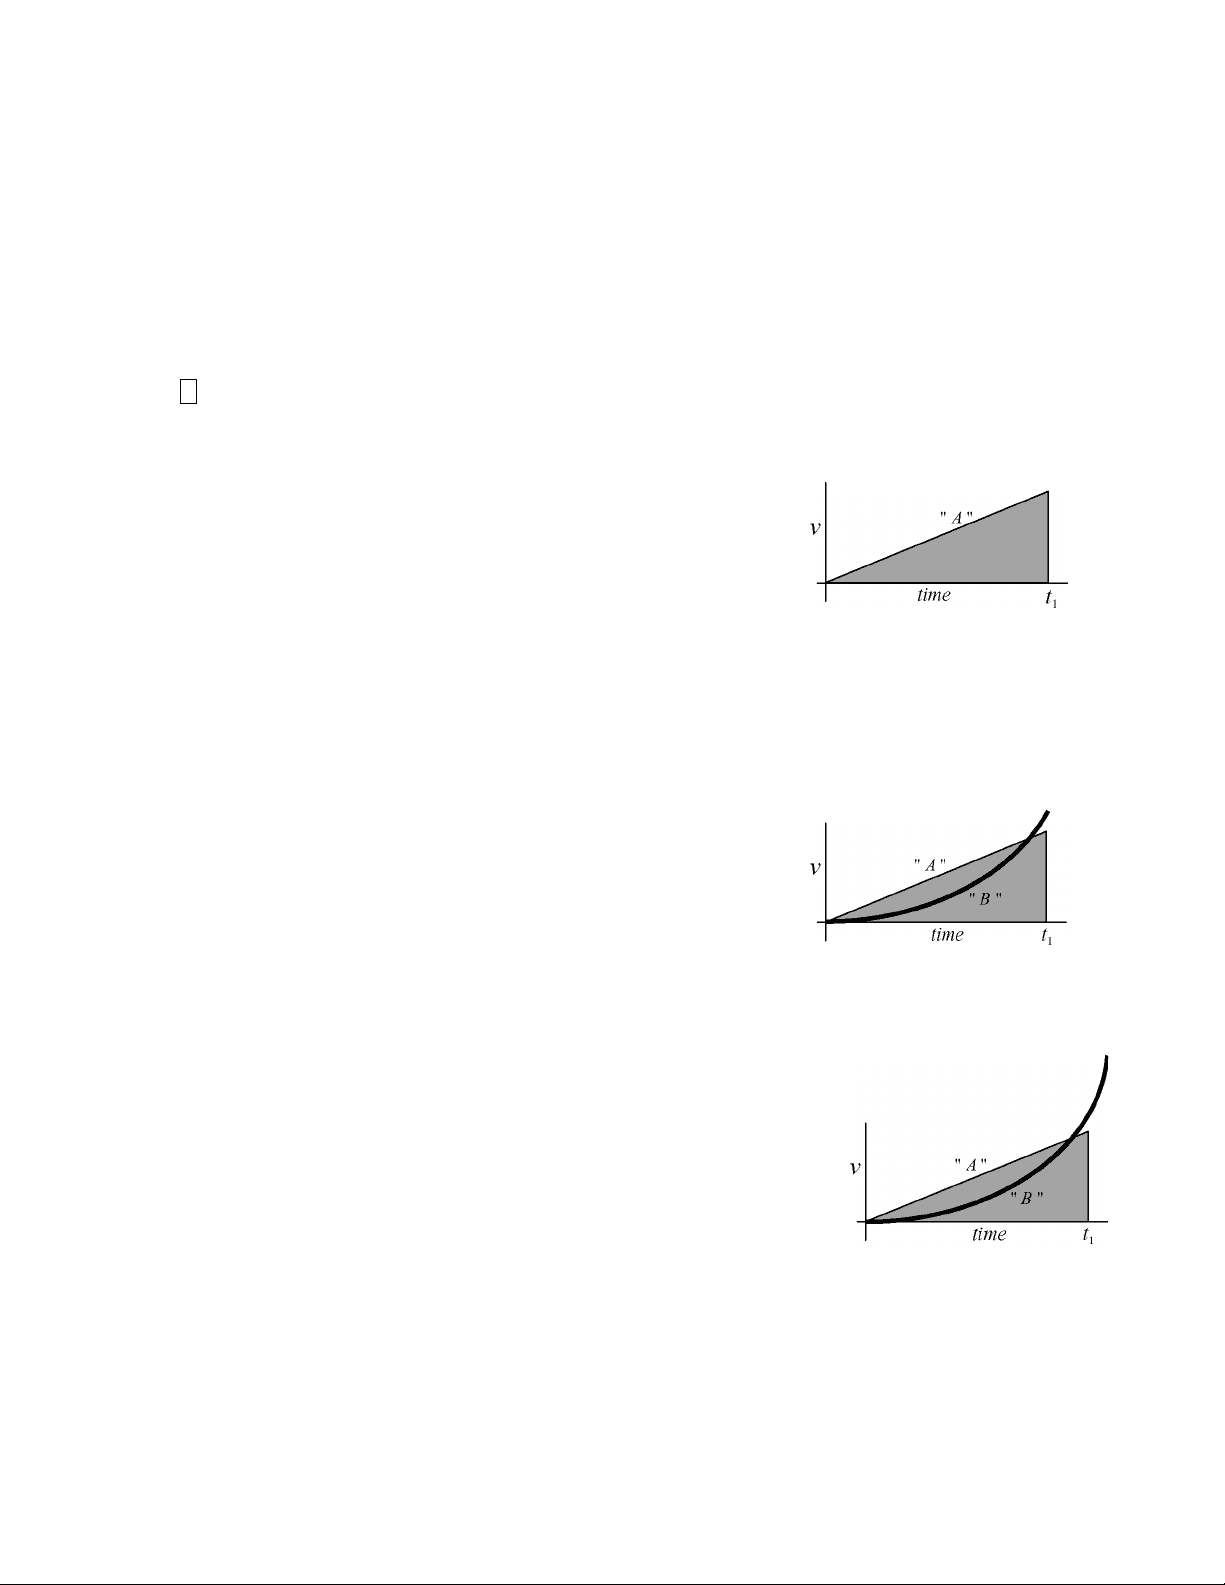
Consider this scenario. Assume that one car has a constant acceleration down the track. Then a graph
of its speed versus time would look like line " A " on the first graph. The shaded area of the graph
represents the distance traveled, and the graph is plotted to such a time that the shaded area represents
the length of the track. The time for this car to finish the race is labeled " t 1
Now let the second car have a much smaller acceleration initially, but
with an increasing acceleration. A graph of its velocity, superimposed
on the above graph and labeled " B ", might look like the second
diagram.
It is seen that at the time t 1 when the first car finished the race, the second car is going faster than the
first car, because the heavy line is “higher” on the graph than the line representing the first car.
However, the area under the "B" line (the distance that the second car has
traveled) is smaller than the shaded area, and so is less than the full track
length. For the area under the "B" line to be the same as the area under the
"A" line, the graph would need to look like the third diagram, indicating a
longer time for the second car to finish the race.
the object dropped first will always have a greater speed than the object dropped second, but both
will have the same acceleration of 9.80 m/s
2
.
Chapter 2 Describing Motion: Kinematics in One Dimension
© 2005 Pearson Education, Inc., Upper Saddle River, NJ. All rights reserved. This material is protected under all copyright laws
as they currently exist. No portion of this material may be reproduced, in any form or by any means, without permission in
writing from the publisher.
Solutions to Problems
- The average speed is given by:
v = d! t = 235 km 3.25 h = 72.3 km h.
- The distance of travel (displacement) can be found by rearranging the average speed equation. Also
note that the units of the velocity and the time are not the same, so the speed units will be converted.
v =
d
! t
" d = v! t = 110 km h
1 h
3600 s
2.0 s
= 0.061 km = 61 m
- The average velocity is given by v =
! x
! t
"4.2 cm " 3.4 cm
6.1 s " 3.0 s
"7.6 cm
3.1 s
= "2.5 cm s.
- The time for the first part of the trip is calculated from the initial speed and the first distance.
ave speed
1
= v
1
d
1
! t
1
"! t
1
d
1
v
1
130 km
95 km h
= 1.37 h = 82 min
The time for the second part of the trip is therefore
! t
2
=! t
tot
"! t
1
= 3.33 h " 1.37 h = 1.96 h = 118 min
The distance for the second part of the trip is calculated from the average speed for that part of the
trip and the time for that part of the trip.
ave speed
2
= v
2
d
2
! t
2
" d
2
= v
2
! t
2
= 65 km h
1.96 h
( )
= 127.5 km = 1.3 # 10
2
km
( a ) The total distance is then d total
= d 1
= 130 km + 127.5 km = 257.5 km! 2.6 " 10
2
km
( b ) The average speed is NOT the average of the two speeds. Use the definition of average speed.
ave speed =
d total
! t total
257.5 km
3.33 h
= 77 km h
- The distance traveled is 2.0 miles
8 laps! 0.25 mi lap
The displacement is 0 because the ending
point is the same as the starting point.
( a ) Average speed =
d
! t
2.0 mi
12.5 min
2 mi
12.5 min
1610 m
1 mi
1 min
60 s
= 4.3 m s
Chapter 2 Describing Motion: Kinematics in One Dimension
© 2005 Pearson Education, Inc., Upper Saddle River, NJ. All rights reserved. This material is protected under all copyright laws
as they currently exist. No portion of this material may be reproduced, in any form or by any means, without permission in
writing from the publisher.
thrown. The acceleration is
a = !9.80 m s
2
The displacement upon catching the ball is 0, assuming
it was caught at the same height from which it was thrown. The starting speed can be found from Eq.
2 - 11b, with x replaced by y.
y = y 0
t +
1
2
at
2
v 0
y " y 0
1
2
at
2
t
1
2
at = "
1
2
"9.80 m s
2
( )
3.0 s ( ) = 14.7 m s # 15 m s
The height can be calculated from Eq. 2-11c, with a final velocity of v = 0 at the top of the path.
v
2
= v 0
2
( ) " y = y 0
v
2
! v 0
2
2 a
0! 14.7 m s ( )
2
2 !9.8 m s
2
( )
= 11 m
- Choose downward to be the positive direction, and take y 0
to be the height where the object was
released. The initial velocity is v
0
= !5.20 m s
2
,the acceleration is a = 9.80 m s
2
,and the
displacement of the package will be y = 125 m.The time to reach the ground can be found from Eq.
2 - 11b, with x replaced by y.
y = y 0
t +
1
2
at
2
! t
2
2 v 0
a
t "
2 y
a
= 0! t
2
2 (" 5.2 m s)
9.80 m s
2
t "
2 125 m ( )
9.80 m s
2
t = 5.61 s, "4.55 s
The correct time is the positive answer, t = 5.61 s.