Download Fun and Interactive Flowcharts: Learning Data and Sequences for Students and more Assignments Engineering in PDF only on Docsity!
Property of Iowa State University Engineering Community Outreach: No duplication without permission. Version 5/7/
Activity: Flowcharts
Grades: 2-
Length: 45 minutes
Concepts: Flowcharts, flow, sequences, data Materials : household items, pencil, paper
Background Information:
What is a flowchart?
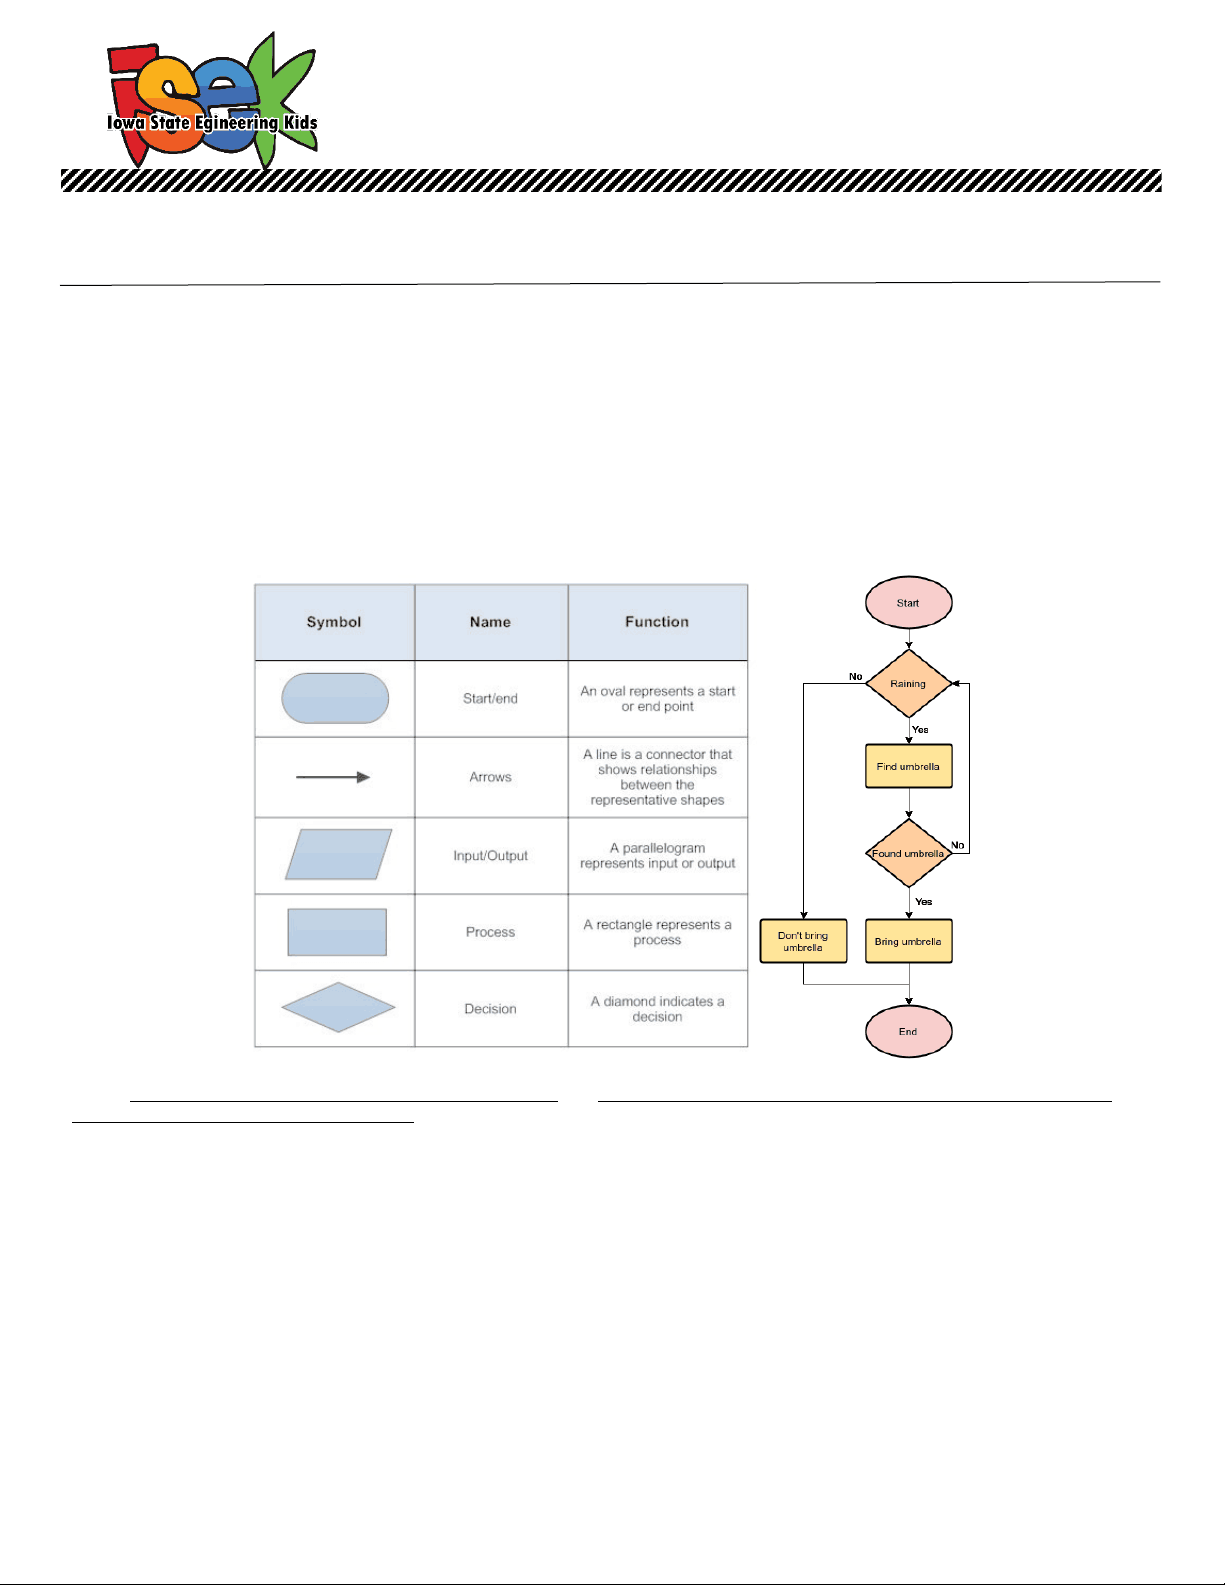
A flowchart is a diagram that depicts a process, system, or computer algorithm for just about anything you can imagine. They are used in multiple fields to document, study, plan, and communicate complex processes in a clear, easy manner. They use different shapes, such as rectangles, ovals and diamonds to define each step along with arrows pointing to define the flow and sequence. It is a fun and easy way to visualize, or see, your information known as data.
Here is an example of a simple flow chart and what each symbol means:
Credit: www.smartdraw.com/flowchart/flowchart-symbols.htm and https://medium.com/@warren2lynch/a-comprehensive-guide-for- flowchart-over-50-examples-785d6dfdc
You probably use this type of thinking every day. For example if you found a sock on the floor, what would you do? First you might ask yourself whether it was a clean sock or a dirty sock. Depending on that information, you then decide what to do with it. If it was dirty, you might put it with the rest of the laundry. If it is clean, you may need to ask another question: whom does the sock belong to? Depending on that answer, you may need to put it in different places.
Engineers and other STEM professionals use flowcharts to help organize their ideas and communicate to their peers. This type of thinking is also used in programming. In order to tell a computer exactly what to do, a computer programmer needs to provide the computer a set of instructions with great detail. For example, depending on the air temperature in the room, a computer (like in a thermostat) may need to tell the air conditioner or heater to turn on or do nothing. A flowchart can help layout the necessary steps in the programmer’s thinking to make sure the computer has all the steps in the process.
Property of Iowa State University Engineering Community Outreach: No duplication without permission. Version 5/7/
Learn more about flow charts at https://kids.kiddle.co/Flow_chart.
Think about what other kinds of data (information) exist? How do we use data and flowcharts to improve our lives every day? How else can we sort data effectively?
Activity: Start by reading through the Background Information.
What’s the Problem: Today you are going to make your own flowchart. You can make a process
showing your decision making for an activity (like getting dressed) or to identify items inside your own
home (similar to I-Spy).
Be creative and detailed: Since flowcharts are used to communicate your thinking to others, think
through all the steps. If your example is getting dressed, does your outfit depend on the season? Does it
depend on the activity that you will be doing?
Design your Solution: Brainstorm, plan, and draw out your flowchart! If you need ideas of what kind of
flowchart to make, look at the example below. What do you need to consider? What changes your
decision?
Try it Out: Once you have your flow chart, try it out with someone!
Expand Upon your Design. What else needs to be considered? Did you get to the end of your
flowchart? Does anything need to be in a different sequence (order)?
Credit: https://teachersworkstation.files.wordpress.com/2014/06/solid-liquid-gas-flowchart.png
Definitions:
- Flowchart: a diagram of the sequence of movements or action of people or things involved in a complex system or activity
- Flow: to go from one place to another in a steady stream
- Sequence: a particular order in which related events, movements, or things follow each other
- Data: information collected, something that is known to help make decisions
Reading and Resources:
Books and Articles
- Are We There Yet? 36 Eye-Rolling Flowcharts
from the Wonderfully Weird Brains of Children by David Vienna
- Logic and Data: Computer by Tracy A. Gardner
Videos
- An overview of flowcharts www.youtube.com/watch?v=uCNliFuKG8I
- What is an Algorithm? www.youtube.com/watch?v=Da5TOXCwLSg
Check out more great resources at www.isek.iastate.edu!